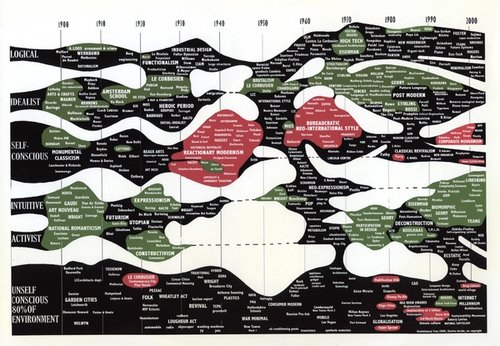
Diagrams were at the core of Charles Jencks’ practice as a writer and historian of architecture. Beyond visualising and classifying architectural styles and traditions, his diagrams provided a visual tool to analyse, understand and represent dynamic relations between architecture and society, and to trace – and continually re-trace – complex flows of social, technological, scientific and architectural change.
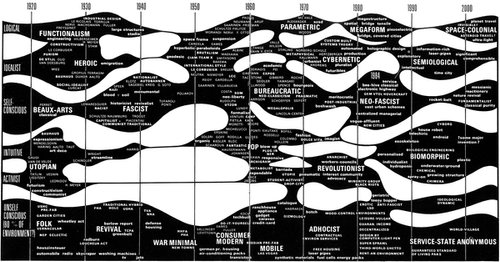
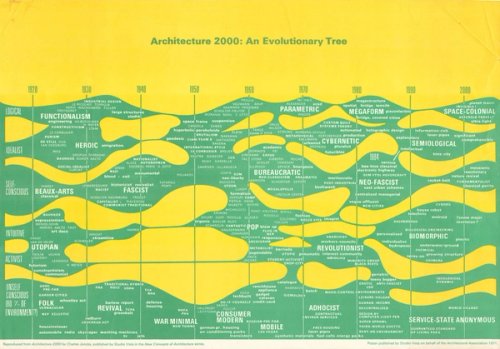
One of his most influential diagrams, The Evolutionary Tree (which itself evolved over the years) distinguished between six traditions or future trends. These were represented as a series of undulating blobs, architecture and society’s pulsations between opposing ideals, that were mapped on a grid – a timeline stretching between 1920 and 2000 on which social trends and technological innovations were both retrospectively mapped and projected into the future.
Jencks studied the past in order to predict the future. But this exercise was not only analytical and predictive, it also had a moral dimension. As Jencks quoted from McLuhan: ‘There is absolutely no inevitability as long as there is a willingness to contemplate what is happening.’ Thus the diagram was as much a prediction as it was a provocation and a call to action.